Keeping Your Kubernetes Ship Afloat with Keptn and SLOs
Running workloads on Kubernetes often feels like sailing a large ship. Most days the sea is calm. Deployments roll out, metrics look green, and nothing catches fire. But when things go wrong, they usually go wrong fast. Latency spikes, error rates increase, users complain, and suddenly everyone is staring at dashboards trying to decide what matters and what doesn’t.
Working with Kubernetes in production daily, I have learned one thing very clearly: alerts alone are not enough. You can have Prometheus, Grafana, logs, traces, and still miss the real question during an incident: are users actually affected, and should we act now?
This is where Service Level Objectives (SLOs) come in. And this is where Keptn becomes interesting. Not as another dashboard, but as a control plane that connects service behavior to engineering decisions.
![]()
In this article, I want to look at Kubernetes, SLOs, and Keptn from a practical SRE perspective. First, we go through the thinking behind SLOs and why they matter in real clusters. Then we look at how Keptn fits into this picture architecturally. After that, we build everything step by step, deploy a sample application, introduce a real failure, and let Keptn tell us if we should care or not.
Why SLOs matter more than alerts
Most Kubernetes setups start with alerts. CPU too high. Memory too low. Pod restarted. Node not ready. All useful signals, but none of them answer the user question. A pod restart does not always mean an outage. High CPU can be perfectly fine during a batch job. Yet these alerts wake people up at night.
SLOs flip this around. Instead of asking what is broken? they ask is the service still good enough for users? An SLO is a target, for example: 99.9% of requests should be successful over the last 30 days, or 95% of requests should be faster than 500 ms.
This changes behavior. Engineers stop reacting to every small spike and start protecting error budgets. If you still have budget left, you can take risks. If the budget is gone, you slow down and stabilize. This is classic SRE thinking, but surprisingly few Kubernetes teams really implement it.
The hard part is not defining SLOs. The hard part is enforcing them consistently and using them during incidents and deployments. This is exactly the space where Keptn operates.
What Keptn actually does
Keptn is an Open Source control plane for SLO-driven operations. It does not replace Prometheus. It does not replace Kubernetes. Instead, it sits above your observability stack and evaluates service behavior against defined objectives.
At its core, Keptn evaluates Service Level Indicators when triggered, for example during deployments, incidents, or explicit analyses. Based on this evaluation, Keptn can tell you if a service is healthy, degraded, or violating its objectives.
The important detail is that Keptn focuses on decisions, not just data. It answers questions like “Is this deployment still acceptable?”, “Did this change hurt user experience?”, and “Should we roll back, stop, or continue?”
In Kubernetes environments, this becomes very powerful when you combine it with GitOps, CI/CD, or incident workflows.
Keptn in a Kubernetes World
Keptn runs inside your cluster as a set of controllers and services. It integrates with Prometheus (or other metrics backends) to fetch SLIs, evaluates them based on your SLO definitions, and exposes results via APIs and events.
From an architectural point of view, Keptn becomes a decision layer. Kubernetes still schedules pods. Prometheus still scrapes metrics. Your application still serves traffic. Keptn only observes and evaluates.
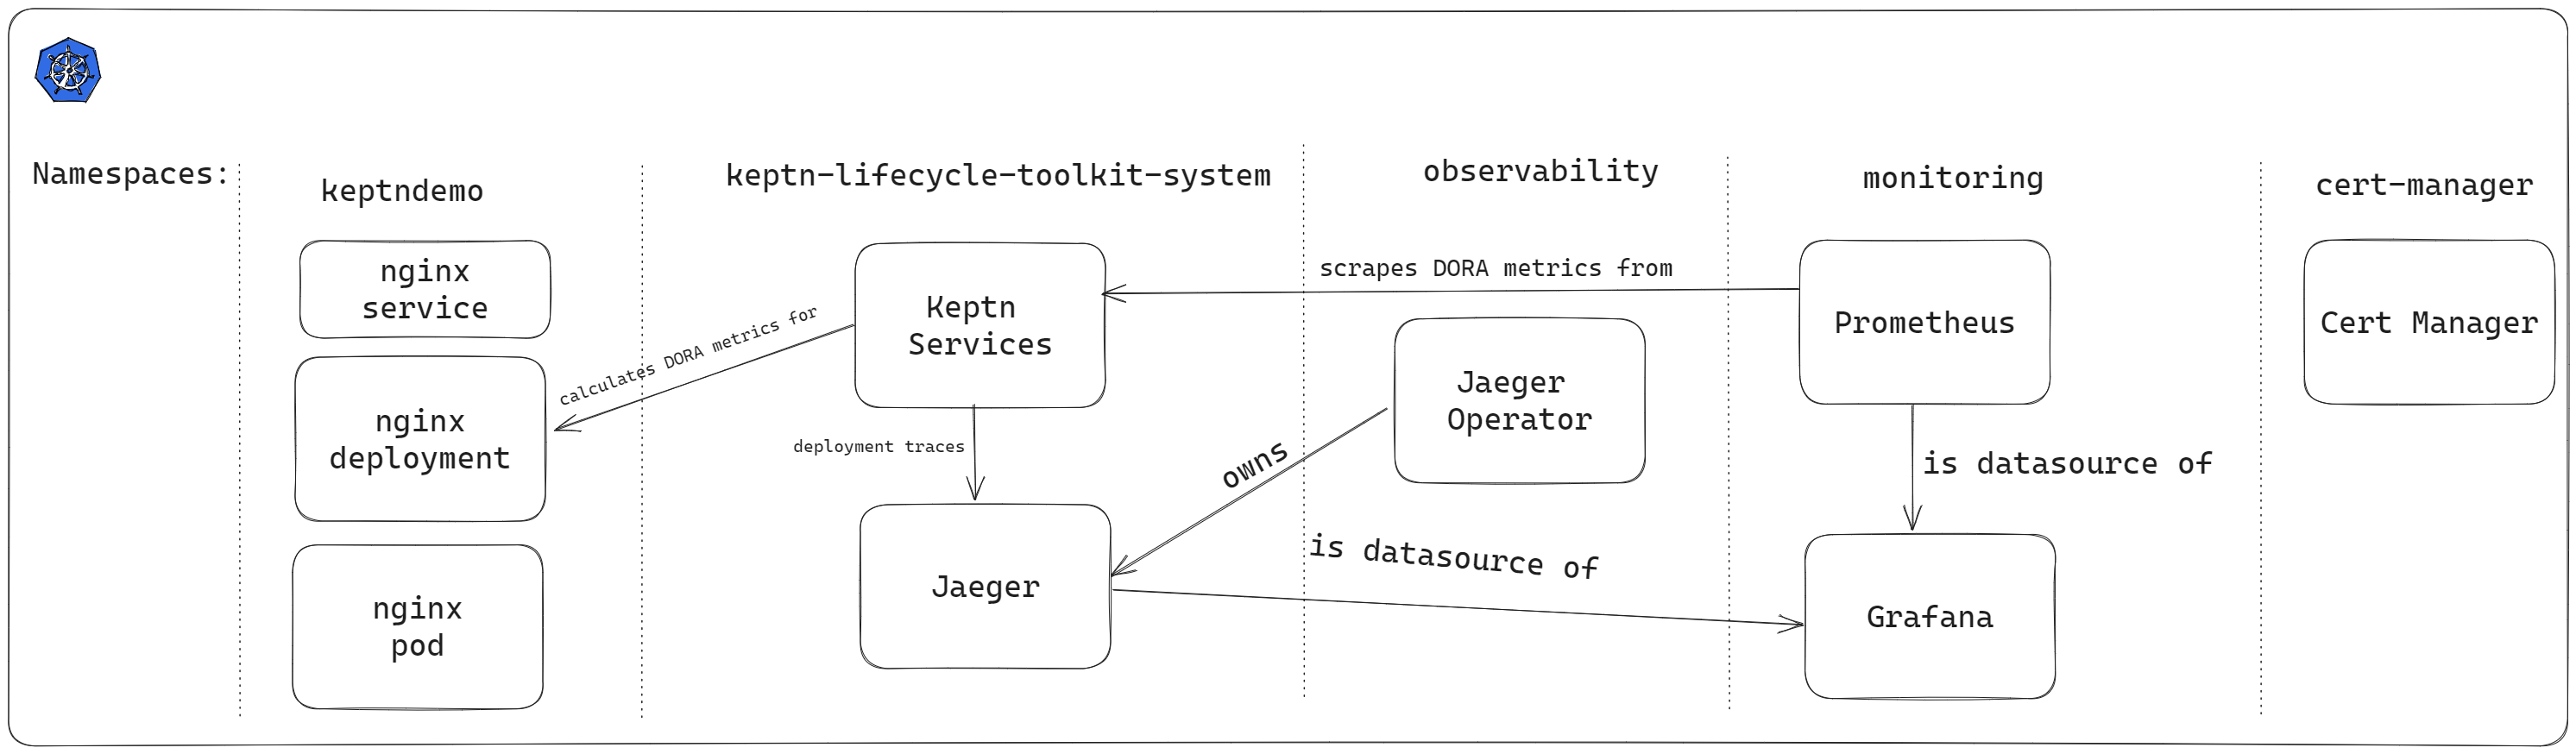
This separation is important. Keptn does not need cluster-admin access to your workloads. It does not restart pods by itself. It produces signals that other systems can act on. In AKS, this model fits nicely. You keep using managed Kubernetes, managed monitoring, and Open Source tooling, while Keptn adds structure on top.
Implementing SLOs on Kubernetes with Keptn
So far, we talked about why SLOs matter and where Keptn fits into Kubernetes operations. Now it is time to stop talking and actually build something. In this guide, we will create a small but realistic setup:
- A fresh Kubernetes cluster
- Basic monitoring with Prometheus
- A simple application that looks healthy to Kubernetes
- A Keptn SLO that detects user-facing degradation
Nothing fancy, no enterprise shortcuts. Just the minimum you need to understand how this works in practice.
Prerequisites
Before you begin this guide, you will need the following:
Create a Kubernetes Cluster
You can run this on any Kubernetes environment. Because this blog is written from an AKS perspective, we will use Azure Kubernetes Service. If you prefer another distro, the steps are conceptually the same.
Start by creating a resource group:
az group create \
  --name aks-keptn-slo-rg \
  --location westeurope
Now create the AKS cluster:
az aks create \
  --resource-group aks-keptn-slo-rg \
  --name aks-keptn-slo \
  --node-count 3 \
  --enable-managed-identity \
  --generate-ssh-keys
Once the cluster is ready, configure kubectl access:
az aks get-credentials \
  --resource-group aks-keptn-slo-rg \
  --name aks-keptn-slo
Verify that the cluster is reachable with kubectl get nodes.
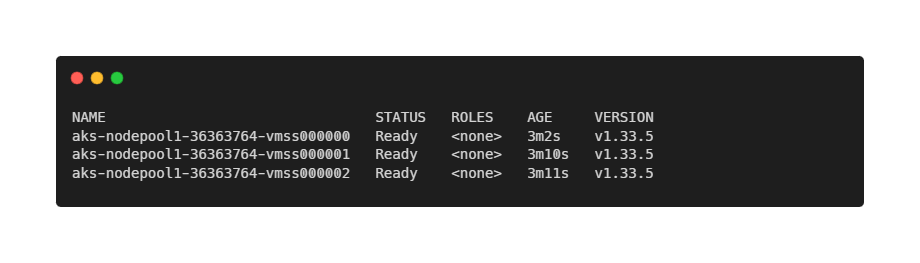
At this point, you have a clean Kubernetes cluster with no workloads and no monitoring. This is exactly where many teams start.
Install Prometheus for Basic Observability
Keptn does not collect metrics itself. It evaluates metrics that already exist. This means we first need a reliable and predictable monitoring setup. For this guide, we use the community-maintained kube-prometheus-stack, which is widely used and well supported.
Add the Prometheus Helm repository and update it:
helm repo add prometheus-community https://prometheus-community.github.io/helm-charts
helm repo update
Create a dedicated namespace for monitoring:
kubectl create namespace monitoringNow install the Prometheus stack:
helm install prometheus prometheus-community/kube-prometheus-stack \
  --namespace monitoring
This installs Prometheus, Alertmanager, Grafana, and Kubernetes and node metrics.
Wait one or two minutes, then verify that all components are running:
kubectl get pods -n monitoringAll pods should be in a Running state.
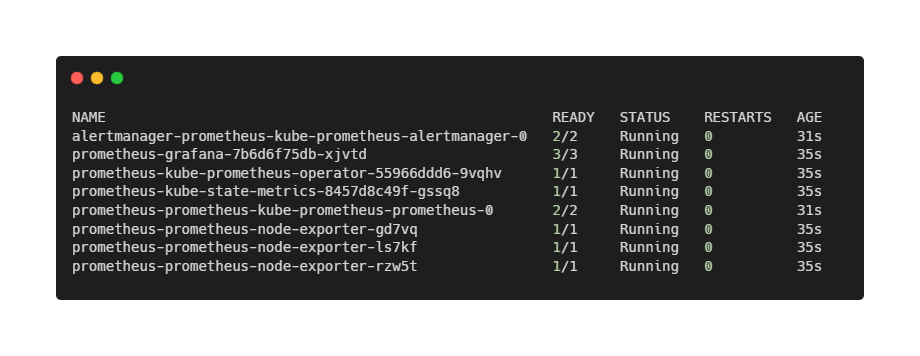
At this point, we have observability, but no opinions. Prometheus collects numbers. It does not tell us whether users are happy. That is exactly the gap Keptn is meant to fill.
Deploying a Demo Application
To keep the focus on Keptn—and not on application complexity—we use Podinfo as our demo workload.
Podinfo is a small, production-grade Go application that behaves like a real microservice. It has health probes, exposes HTTP endpoints, and integrates cleanly with Kubernetes primitives such as readiness and liveness.
For this article, we deliberately do not focus on application-level metrics such as request latency or error rates. While those are important in real SLO implementations, they require additional Prometheus configuration and traffic generation, which distracts from the core Keptn concepts.
Instead, we start with the most basic—and most fundamental—service objective: Is the service available or not?
Availability is already a first-class signal in Kubernetes. Pods are either Ready or Not Ready. This makes it an ideal starting point for introducing SLO-driven evaluations with Keptn.
We deploy Podinfo into a dedicated namespace called demo:
kubectl create namespace demo
kubectl apply -n demo -f https://raw.githubusercontent.com/stefanprodan/podinfo/master/kustomize/deployment.yaml
kubectl apply -n demo -f https://raw.githubusercontent.com/stefanprodan/podinfo/master/kustomize/service.yaml
After a few seconds, the pod should be running:
kubectl get pods -n demo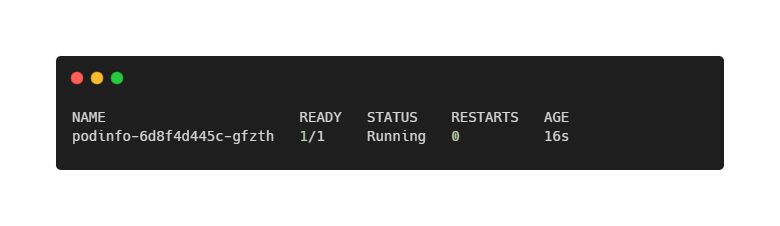
At this point, we have everything Keptn needs: a versioned workload and a clear, Kubernetes-native signal that represents service availability. Let’s continue with the installation of Keptn itself!
Installing Keptn in the Cluster
With Prometheus running and Podinfo exposing meaningful application metrics, we can finally introduce Keptn. This is the point where raw observability turns into actionable insight. It is important to be precise here, because Keptn has evolved significantly over time. In this guide, we use Keptn Lifecycle Toolkit, the modern, Kubernetes-native implementation focused on SLO evaluation and workload orchestration.
Keptn Lifecycle does not introduce a centralized control plane, databases, or message brokers. Instead, it integrates directly into Kubernetes using controllers and Custom Resource Definitions (CRDs). This makes it lightweight, transparent, and easy to reason about—especially in production environments.
Keptn must run in its own namespace and should not share that namespace with application workloads or infrastructure components. We start by adding the official Keptn Lifecycle Helm repository:
helm repo add keptn https://charts.lifecycle.keptn.sh
helm repo update
Now install Keptn into the cluster:
helm upgrade --install keptn keptn/keptn \
  -n keptn-system \
  --create-namespace \
  --wait
After a short while, verify that the Keptn components are running:
kubectl get pods -n keptn-systemYou should see pods similar to: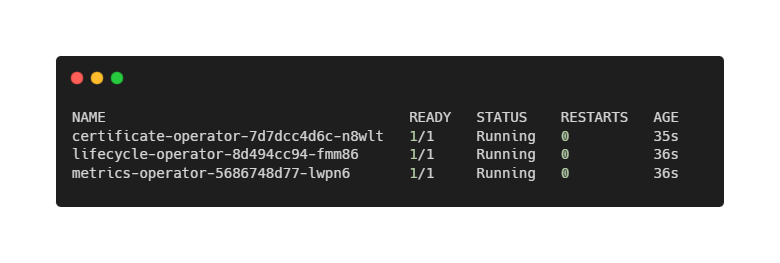
Notably absent are databases, queues, or UI components. Keptn Lifecycle is intentionally minimal. Its job is not to store data or visualize metrics, but to evaluate service behavior against objectives and surface decisions. At this point, Keptn is installed—but it does not yet know where your metrics live.
Connecting Keptn to Prometheus
At this point, Prometheus is already collecting a rich set of Kubernetes-native metrics via kube-state-metrics. These metrics describe the desired and actual state of workloads, such as pod readiness, replica counts, and deployment health.
This is important: even without scraping any application-specific metrics, we already have enough information to define meaningful availability SLOs.
Keptn does not scrape metrics itself. Instead, it queries existing monitoring systems. To tell Keptn how to access Prometheus, we define a KeptnMetricsProvider.
First, confirm the Prometheus service address. When using kube-prometheus-stack, Prometheus is exposed internally as:
kubectl get svc -n monitoring | grep prometheus-operatedWith that in place, create the metrics provider:
apiVersion: metrics.keptn.sh/v1
kind: KeptnMetricsProvider
metadata:
  name: prometheus
  namespace: demo
spec:
  type: prometheus
  targetServer: http://prometheus-operated.monitoring:9090
Apply it to the cluster:
kubectl apply -f keptn-metrics-provider.yamlFrom this moment on, Keptn can query Prometheus for any metric available in the cluster—including the Podinfo metrics we verified earlier. Still, Keptn does not evaluate anything yet. For that, we need to define what “good” actually means.
Defining SLIs with AnalysisValueTemplates
Before we can define Service Level Objectives, we need to tell Keptn how to measure reality. In Keptn terminology, this is done using AnalysisValueTemplates.
For our first SLI, we keep things intentionally simple. We measure pod readiness, a Kubernetes-native signal that answers a fundamental question: “Is the service available to receive traffic?”
The metric we use is provided by kube-state-metrics and is already scraped by Prometheus as part of the kube-prometheus-stack installation.
Create podinfo-ready.yaml:
apiVersion: metrics.keptn.sh/v1
kind: AnalysisValueTemplate
metadata:
  name: podinfo-ready
  namespace: demo
spec:
  provider:
    name: prometheus
  query: |
    (
      avg(
        kube_pod_status_ready{
          namespace="demo",
          pod=~"podinfo.*",
          condition="true"
        }
      )
    ) or vector(0)
This query returns 1 when all Podinfo pods are Ready, or 0 when no Podinfo pods are Ready.
Using avg() allows the metric to scale naturally if the deployment later runs multiple replicas.
Apply the template:
kubectl apply -f podinfo-ready.yamlAt this point, Keptn knows how to measure availability, but it still does not know what is acceptable. That is where SLOs come in.
Defining an Availability SLO
Now that we have an SLI, we can define our first Service Level Objective. Our objective is intentionally strict: The service must be available.
Create podinfo-analysis-definition.yaml:
apiVersion: metrics.keptn.sh/v1
kind: AnalysisDefinition
metadata:
  name: podinfo-slo
  namespace: demo
spec:
  objectives:
    - analysisValueTemplateRef:
        name: podinfo-ready
      target:
        failure:
          lessThan:
            fixedValue: "1"
      keyObjective: true
      weight: 1

  totalScore:
    passPercentage: 100
    warningPercentage: 0
This definition means that the analysis fails if the service is not Ready, there are no warnings or partial passes, and Availability is treated as a hard requirement.
Apply the definition:
kubectl apply -f podinfo-analysis-definition.yamlWith this in place, we have expressed a clear, business-relevant rule in a machine-readable form.
Running an Evaluation
With the SLI and SLO defined, we can trigger an evaluation.
Create podinfo-analysis.yaml:
apiVersion: metrics.keptn.sh/v1
kind: Analysis
metadata:
  name: podinfo-analysis
  namespace: demo
spec:
  timeframe:
    recent: 1m
  analysisDefinition:
    name: podinfo-slo
Apply it:
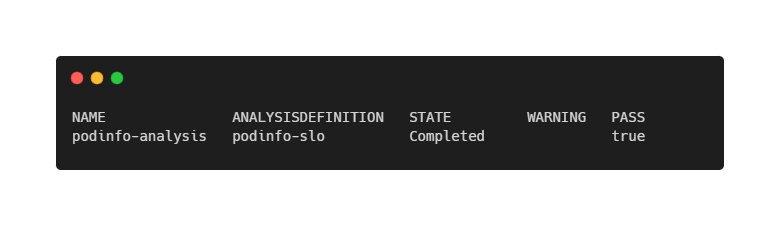
kubectl apply -f podinfo-analysis.yamlCheck the result:
kubectl get analysis -n demoWithin seconds, the analysis should move to Completed and report a successful evaluation.
Let Keptn Decide When Things Break
To demonstrate the value of SLO-based evaluation, we now introduce a real failure.
Scale the Podinfo deployment down to zero replicas:
kubectl scale deployment podinfo -n demo --replicas=0After a short delay, run the analysis again:
kubectl apply -f podinfo-analysis.yamlThis time, the result will be a Completed analysis again, but without passing the evaluation (and thus, failure).
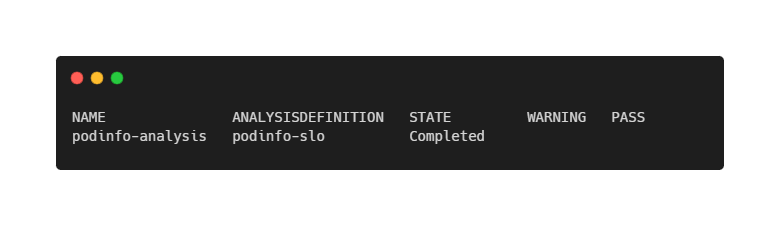
Nothing crashed. Kubernetes did exactly what it was told to do. But from a service-level perspective, the application is unavailable—and Keptn correctly flags this as an SLO violation.
This is the key difference between raw metrics and SLO-driven decisions.
Closing Words
In this article, we did not build a perfect SLO setup. And that is intentional. Instead of starting with complex latency histograms, golden signals, or ingress-level metrics, we began with the simplest possible question: Is the service available or not?
What this walkthrough shows is that SLOs are not about fancy dashboards or advanced tooling. They are about making assumptions explicit. What does “healthy” mean? What does “unavailable” mean? And what should happen when reality no longer matches those expectations? Keptn does not magically answer these questions for you. What it does very well is force you to encode the answers in a precise, machine-readable way—and then evaluate them consistently.
From here, you can extend this setup naturally. For example by adding latency or error-rate SLIs, evaluate SLOs automatically during deployments, gate rollouts or trigger alerts based on SLO violations, or feed Keptn decisions into GitOps or CI/CD pipelines. The core idea remains the same:
- Kubernetes tells you what is happening.
- Prometheus tells you what the numbers are.
- SLOs tell you whether it actually matters.
- And Keptn helps you connect those dots—before users do.
Thank you for taking the time to go through this post and making it to the end. Stay tuned, because we’ll keep continuing providing more content on topics like this in the future.
Author: Rolf Schutten
Posted on: January 29, 2026